


Take Back Monday.

We help publishers aggregate & normalize
their ad revenue and campaign data into a single source of truth.


Enterprise Publisher Analytics & Forecasting Software
Burt is enterprise analytics and forecasting software built for digital publishers and retail media networks. It unifies ad server, SSP, DSP, OMS, social, and CRM data to power reporting, pricing, benchmarking, and revenue intelligence. Burt functions as a unified analytics platform for complex ad tech environments.
Discrepancy Management, Pacing, & Billing
Analyze performance, campaign pacing, and revenue-at-risk with unified publisher reporting software. Reconcile 3p:1p delivery data and discover critical insights before they lead to billing discrepancies and client dissatisfaction.
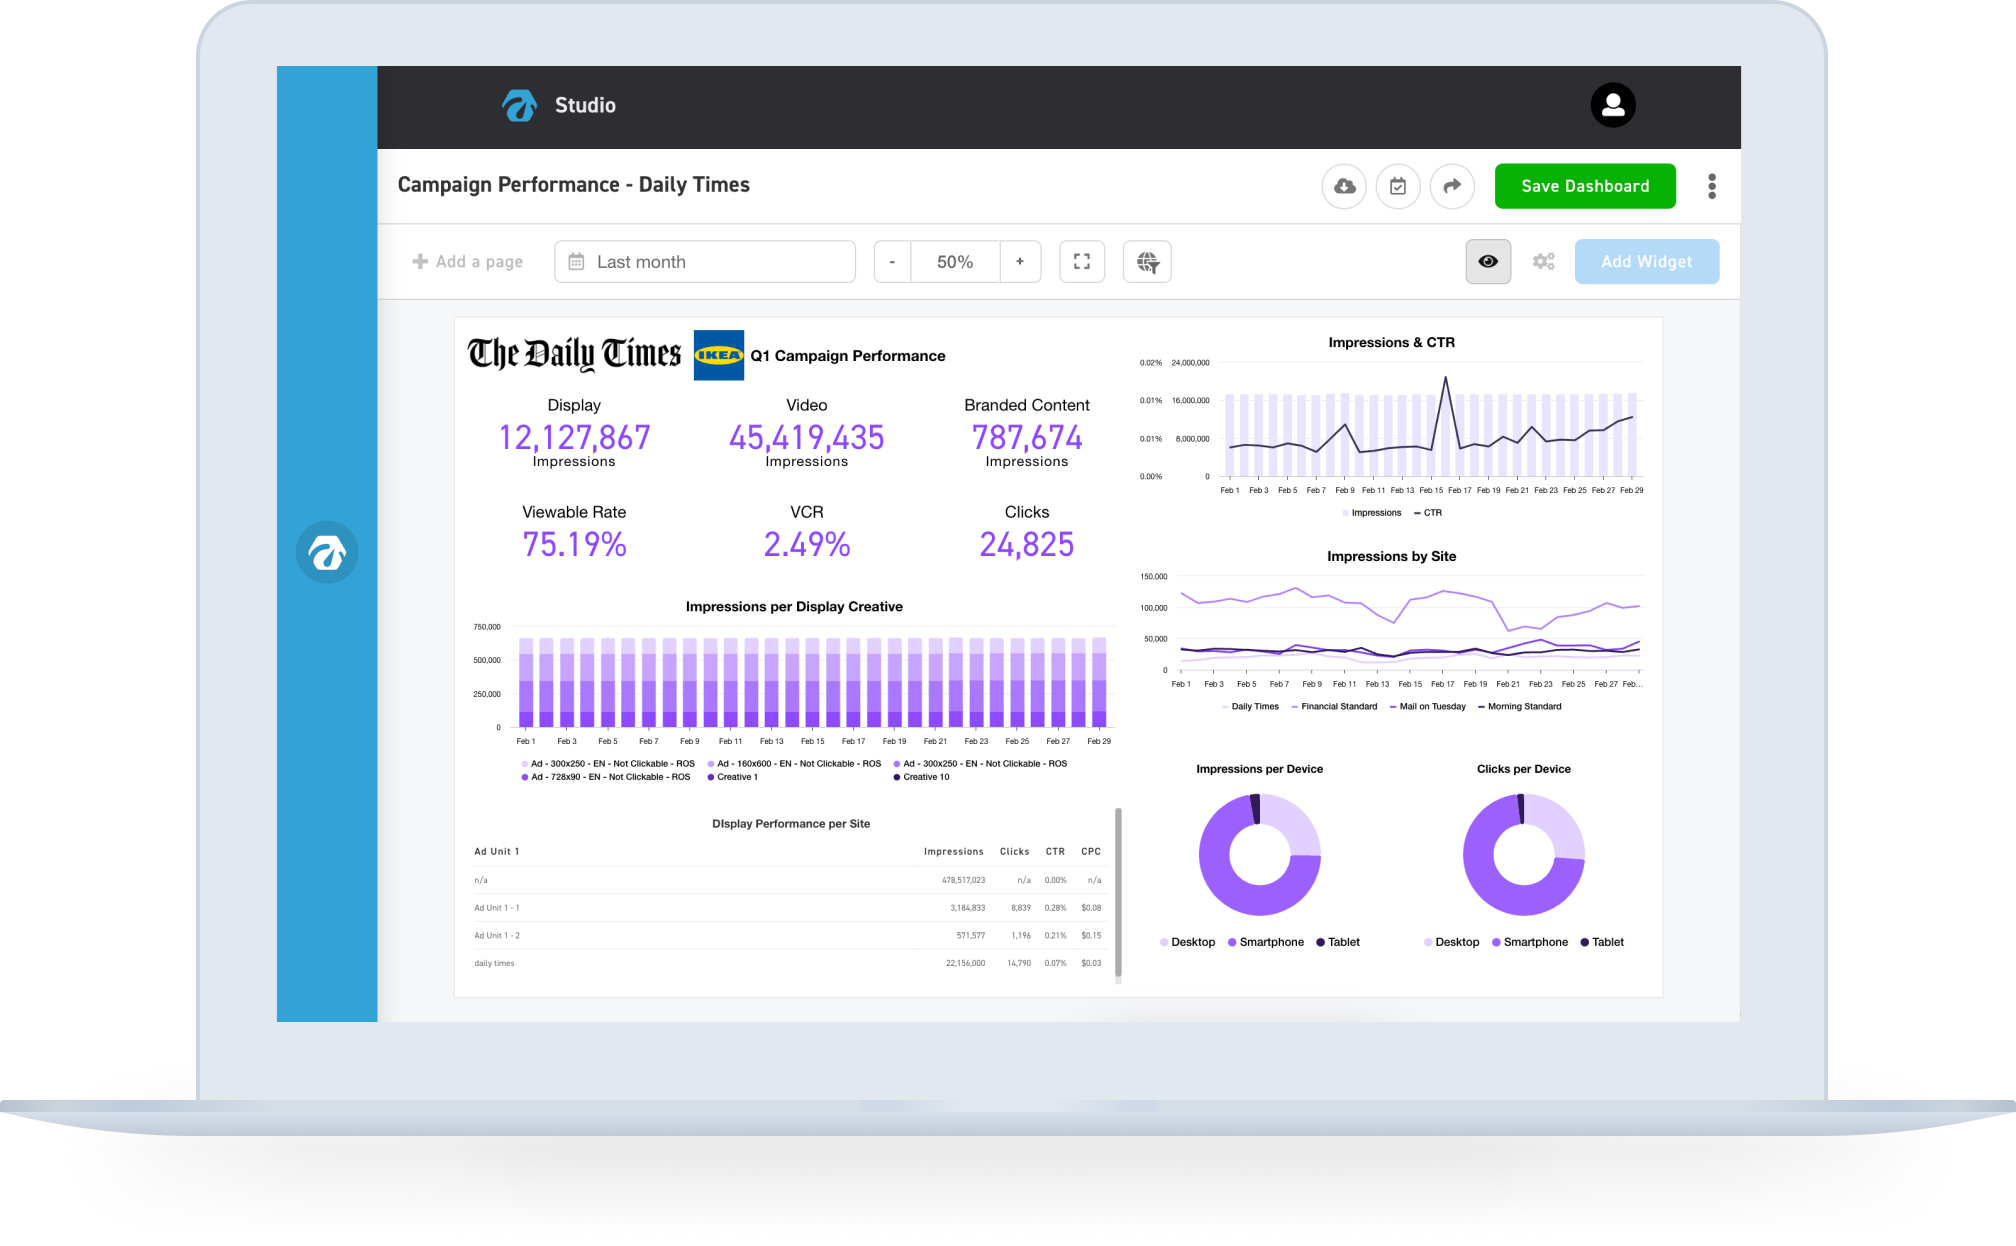
Client-Facing Reporting
Simplify end-of-month and end-of-campaign reporting with automated client-facing reporting. Instantly generate pixel-perfect campaign wrap reports and presentation-ready slide decks using unified campaign data.

Inventory Forecasting &
Yield Management
Predict available inventory with enterprise ad inventory forecasting software built for complex media environments. Get revenue, delivery & CPM analytics, and recommendations on increasing revenue and improving sales performance.

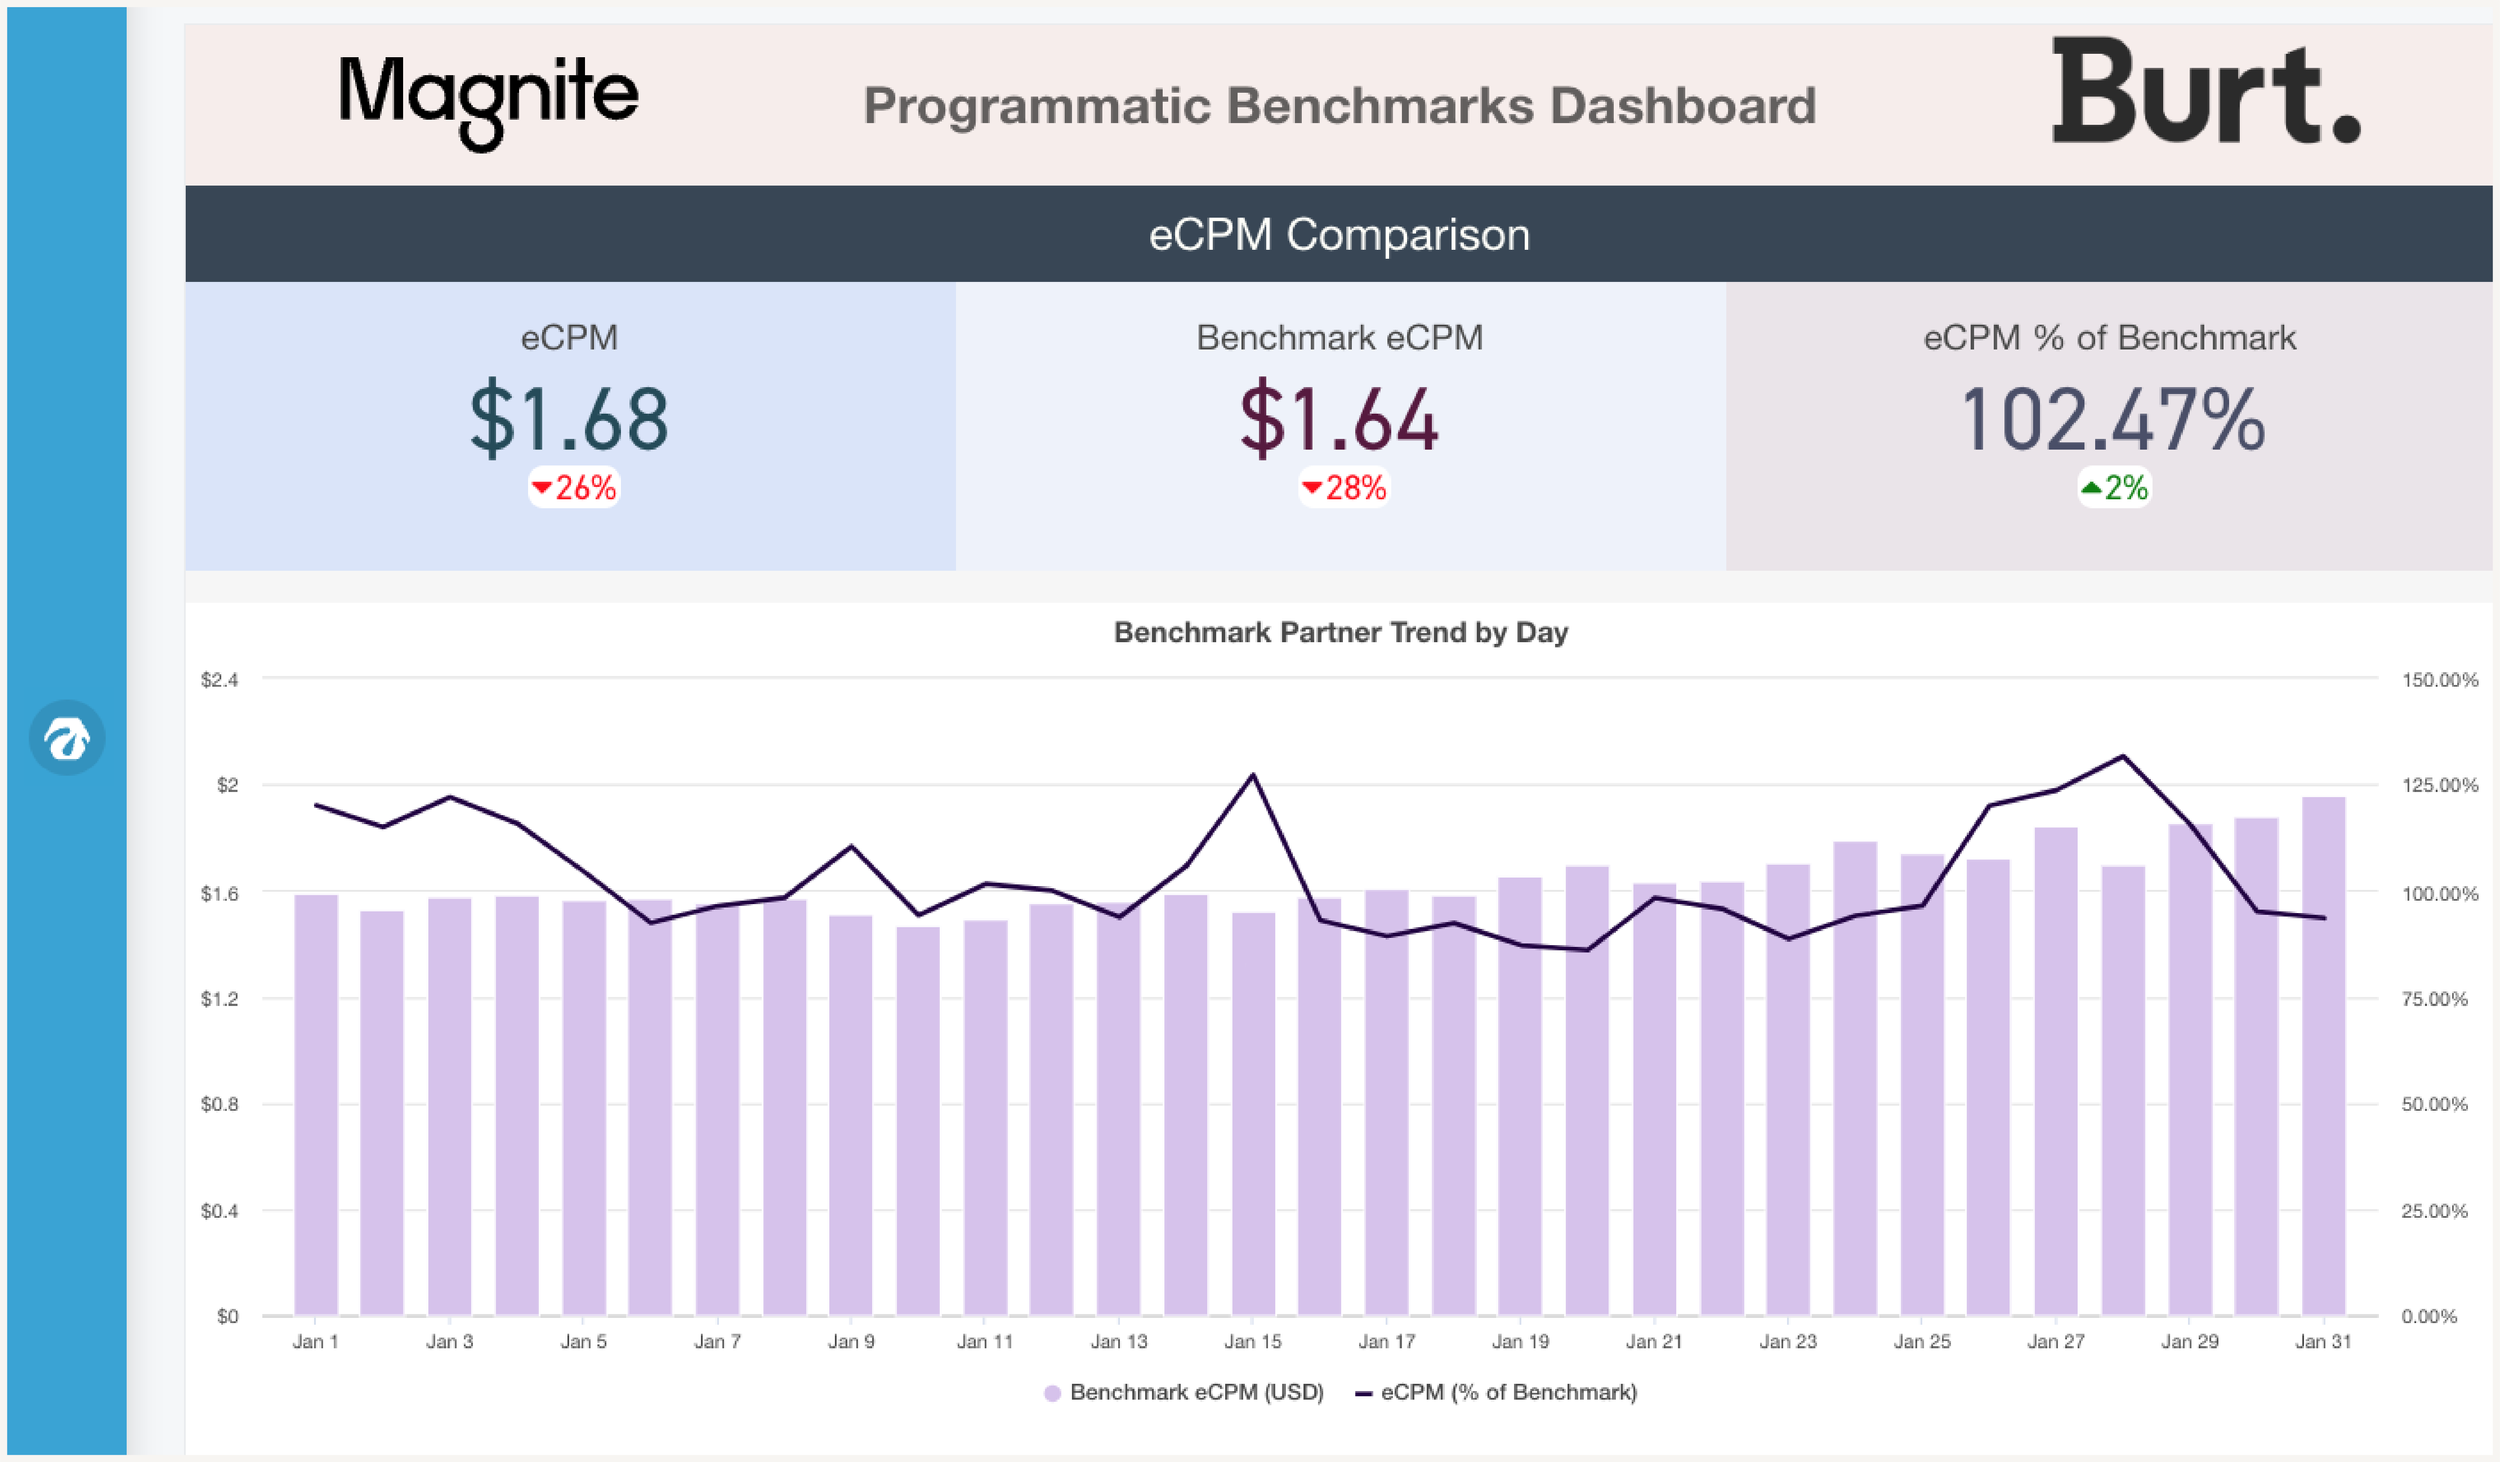
Industry Benchmarking
Contextualize your performance so that you can identify opportunities. Compare your eCPM across advertisers and ad & device types with direct and programmatic benchmarks.
Smart Alerting
Monitor delivery, discrepancies, and performance across direct and programmatic campaigns with customized alerts delivered via email or Slack. Receive actionable campaign alerts and insights powered by Burt Advisor, helping ad operations teams identify and resolve issues quickly.


Sales Intelligence
Discover advertising opportunities using integrated publisher sales intelligence software. Uncover high-intent advertisers, reclaim lapsed deals, and prioritize outreach with confidence. No guesswork required.


And more…
Learn more about our ad inventory forecasting platform, discrepancy reporting software, and advertising benchmarks.
Reach Out Now
Frequently Asked Questions
-
Publisher analytics software unifies reporting, forecasting, reconciliation, and benchmarking to provide revenue visibility across ad tech systems.
-
Retail media analytics software helps retail media networks unify campaign reporting, inventory forecasting, and revenue performance across ad server, DSP, and commerce systems. Burt supports retail media teams managing complex advertiser and inventory data.
-
Burt is built for digital publishers, retail media networks, ad operations teams, and revenue leaders managing complex advertising data.
-
Yes. Burt consolidates reporting, forecasting, benchmarking, and sales intelligence into a single enterprise platform.
-
Burt connects to 200+ advertising and media data sources to enable consolidated reporting across SSPs, DSPs, ad servers, order management systems, social platforms, and CRMs — creating a single source of truth for publisher revenue and campaign performance.
-
Burt's ad discrepancy reconciliation compares third-party delivery data against first-party ad server data to automatically identify and resolve billing discrepancies, flag campaigns not meeting delivery goals, and push clean data back into the order management system or billing endpoint.